mapcomp
mapcomp通过比较SNP序列在参考近缘种基因组的位置,判断两个图谱中标记的对应关系。
Citation:
Sutherland B J G, Gosselin T, Normandeau E, et al. Salmonid chromosome evolution as revealed by a novel method for comparing RADseq linkage maps[J]. bioRxiv, 2016: 039164.
下载安装
在 Github 上: HERE
mapcomp是一系列shell和py脚本,直接下载可用,但是需要依赖以下软件的安装:
Linux or MacOS
Python 2.7
numpy (Python library)
bwa
samtools
The R statistical language
基本用法
注意: 所有指令需要在mapcomp 的根目录下运行, 即"mapcomp"可执行文件所在目录下.
(因为有些shell脚本默认的识别路径是当前目录的某些文件夹)
将参考基因组复制到mapcomp安装目录中"./02_data/genome/"目录下并重命名为"genome.fasta",建立bwa索引。
 cp XXX.fasta 02_data/genome/genome.fasta
 bwa index 02_data/genome/genome.fasta
准备SNP标记和连锁群的数据,格式为6列csv格式表格,如下:
SpeciesName,LG,Position,Zeroes,markerName,markerSequence
注意:
There is no header line in the .csv file
There are 6 columns of information
The different columns are separated by a comma (,)
The fourth column is filled with zeroes (0)
You need more than one map in the .csv file
You should avoid special characters, including underscores (_) in the marker names.
("./01scripts/utilityscripts/findminmaxtotalpositions.py"这个脚本好像是根据""分割数据,所以尽量不要出现"")
You must use the period (.) as the decimal separator (no comma (,))
一个范例csv如下:
hsapiens,1,0.58,0,marker0001,CGGCACCTCCACTGCGGCACGAAGAGTTAGGCCCCGTGCTTTGCGG
hsapiens,1,5.74,0,marker0002,CGGCACCTCCACTGCGGCACGAAGAGTTAGGCCCCGTGCTTTGCGG ... hsapiens,1,122.39,0,marker0227,CGGCACCTCCACTGCGGCACGAAGAGTTAGGCCCCGTGCTTTGCGG
用".csv"文件生成"marker.fasta"
./01_scripts/00_prepare_input_fasta_file_from_csv.sh <your_file.csv>
运行 MapComp
./mapcomp"mapcomp中可以更改"./01scripts/04pairmarkers.py"的参数"maxdist"(默认为10000000), 参数意义是什么?
个人认为是认为两个标记配对的最大碱基距离,默认的1E7已经很大了,越小,配对的标记数越少.考虑到参考基因组的scfd长度,这个参数改动一个数量级基本没有影响,可以不纠结它(个人意见)
查看结果
"03mapped/wantedloci.info": the details needed in marker pairs between species.
(can be useful to obtain exact locations of marker mapping on the reference genome)
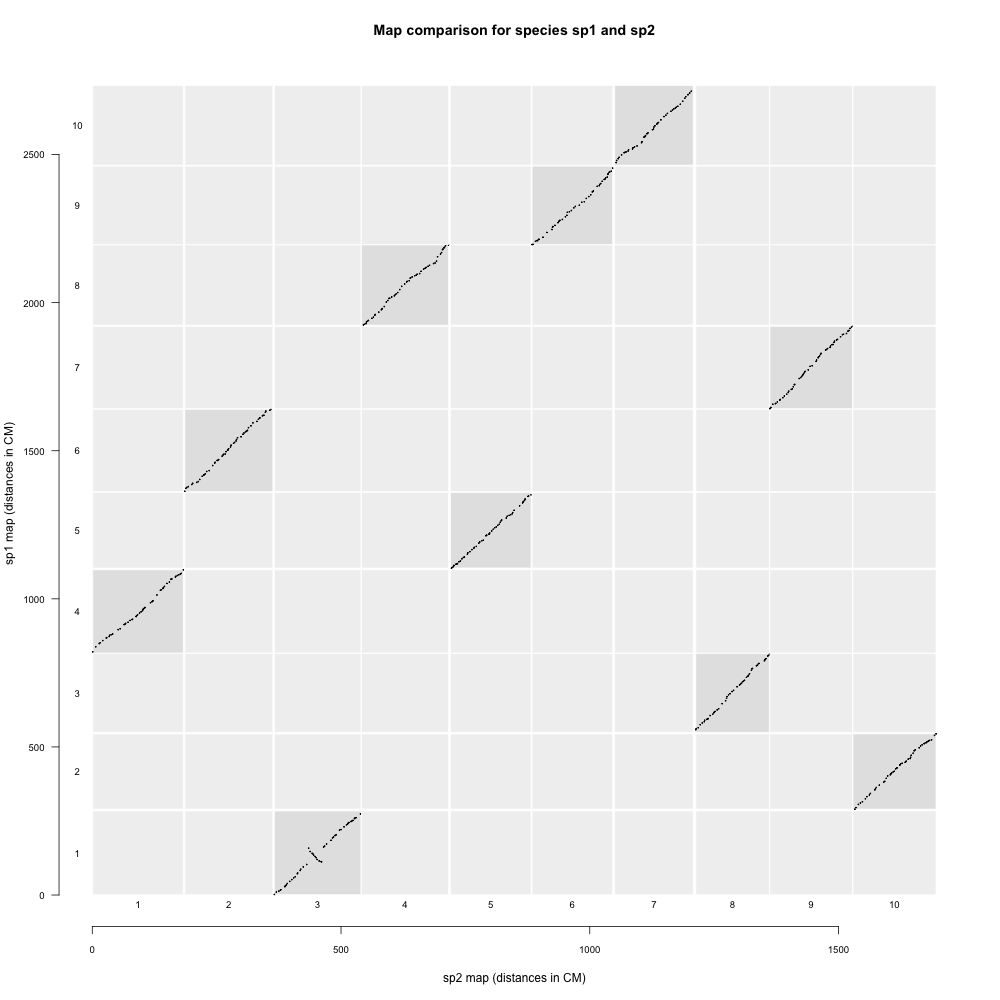
"04_figures": plots comparing between linkage maps
"05_results": a summary of results
示例结果如下: